
Visualize competencies – strengths and weaknesses
- Miriam Oehme

- Sep 20, 2023
- 1 min read
When trying to identify areas of improvement, but also strengths to build upon, many teams and organizations struggle with identifying the most relevant ones.
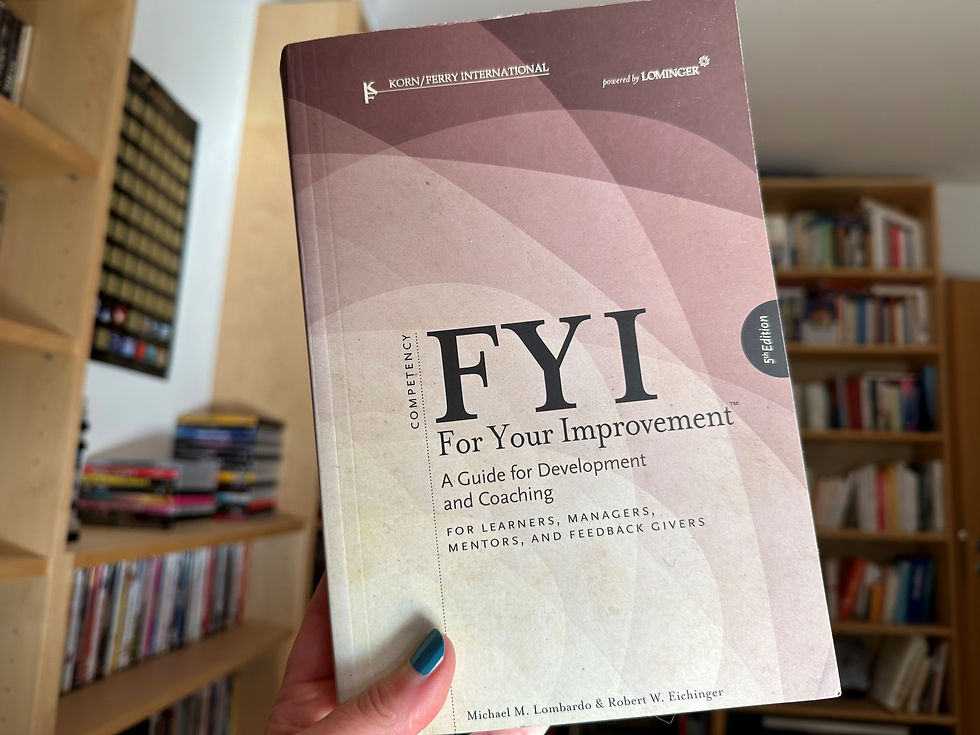
I had already worked with competency frameworks such as “FYI – For Your Improvement” from #kornferry during 1:1 coachings and found it helpful in picking the key areas to further develop from a wide array of competencies.
However, when creating a workshop concept for a global organization I had just started to work with, I wanted to specify the collective competency footprint of the organization and develop a vision for a better version of it.
Splitting the group of about 50 leaders into six breakout groups, I tasked them to visualize the as-is situation on a spiderweb chart and mark the to-be state to aspire for. I had hand-picked the categories based on prior feedback and was excited to see the outcome:
All six groups came up with a very similar pattern and concluded that there were a couple of overused strengths to better tune down a bit, and several underutilized competencies that should be evolved as they create issues with employee morale and attrition.

Using a visual (the one displayed in this post is just illustrative) made it easy to compare patterns and identify areas of improvement. Why not give it a try?
Comments